Find what is actually slowing this PC down.

Bottleneck measures the machine, ranks what is holding it back, and shows you what to change — with the reasoning in plain sight, so you can disagree with it.

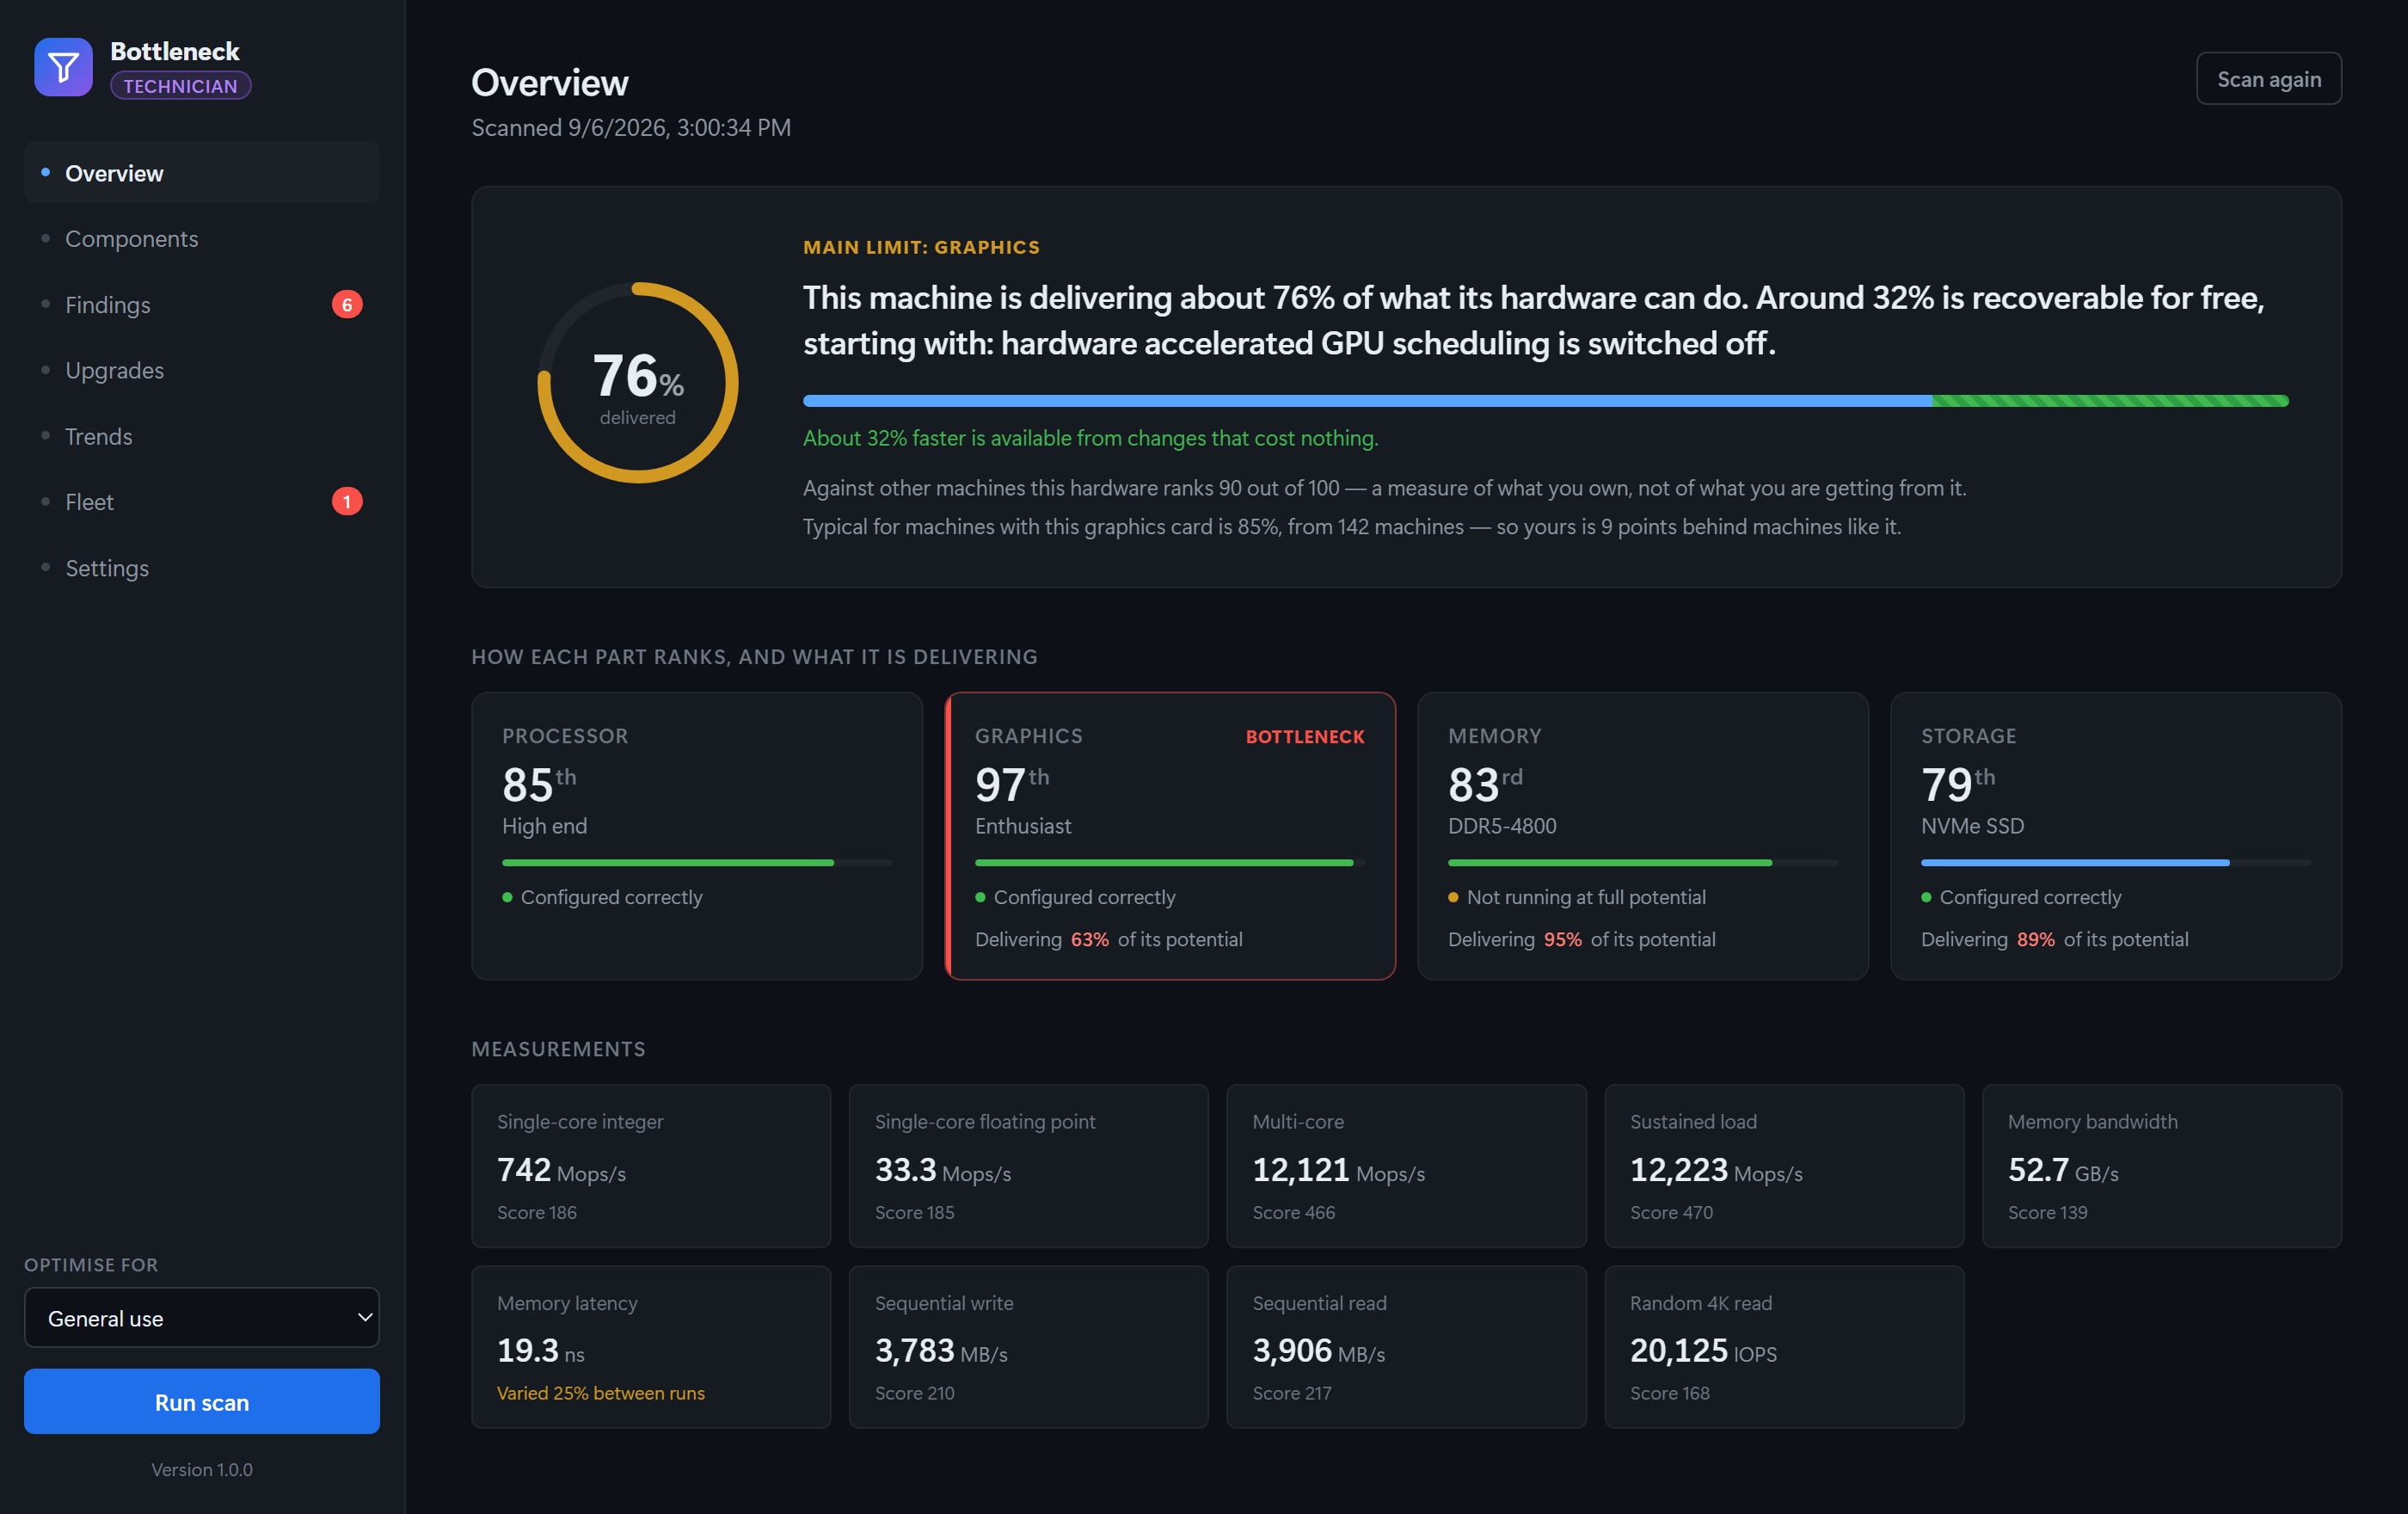
The Bottleneck overview screen. A score ring reads 76% delivered, with the headline: this machine is delivering about 76% of what its hardware can do, and around 32% is recoverable for free. Four component cards show Processor 85th, Graphics 97th flagged as the bottleneck, Memory 83rd and Storage 79th.
The overview screen after a scan. Every number here is measured on the machine in front of you — nothing is uploaded, and the reasoning behind each figure is shown rather than asserted.

The problem

“It’s slow” is not a diagnosis.

Task Manager tells you what is busy right now. Benchmark suites give you a number with no opinion attached. Neither answers the only question that matters: of everything in this machine, which part is the one costing you time, and is replacing it worth the money?

How it works

Measure

Detects the hardware and runs short benchmarks on CPU, memory, disk and graphics. No install required — it will run from a USB stick.

Compare

Scores each component against what current parts of its class actually achieve, using a reference dataset that updates as new hardware ships.

Rank

Sorts what it found by how much it is costing you, and shows the fix for each — settings first, hardware only where settings will not do it.

What you get

Findings, ranked by cost

Every finding carries a severity and an explanation of what it is costing you, not a bare score.

Fix steps, not hints

Each finding says what to change and how. A restrictive power plan is a setting, not a purchase.

An upgrade path, costed

Where hardware genuinely is the limit, it says which part and what the change would buy you.

Trends over time

Scans are kept, so you can see a machine degrade rather than guess whether it used to be faster.

Reports you can hand over

Export a printable HTML report readable by someone who has never seen the application.

Fleet view

On Technician and above, every machine you have scanned side by side, with the estate’s trend.

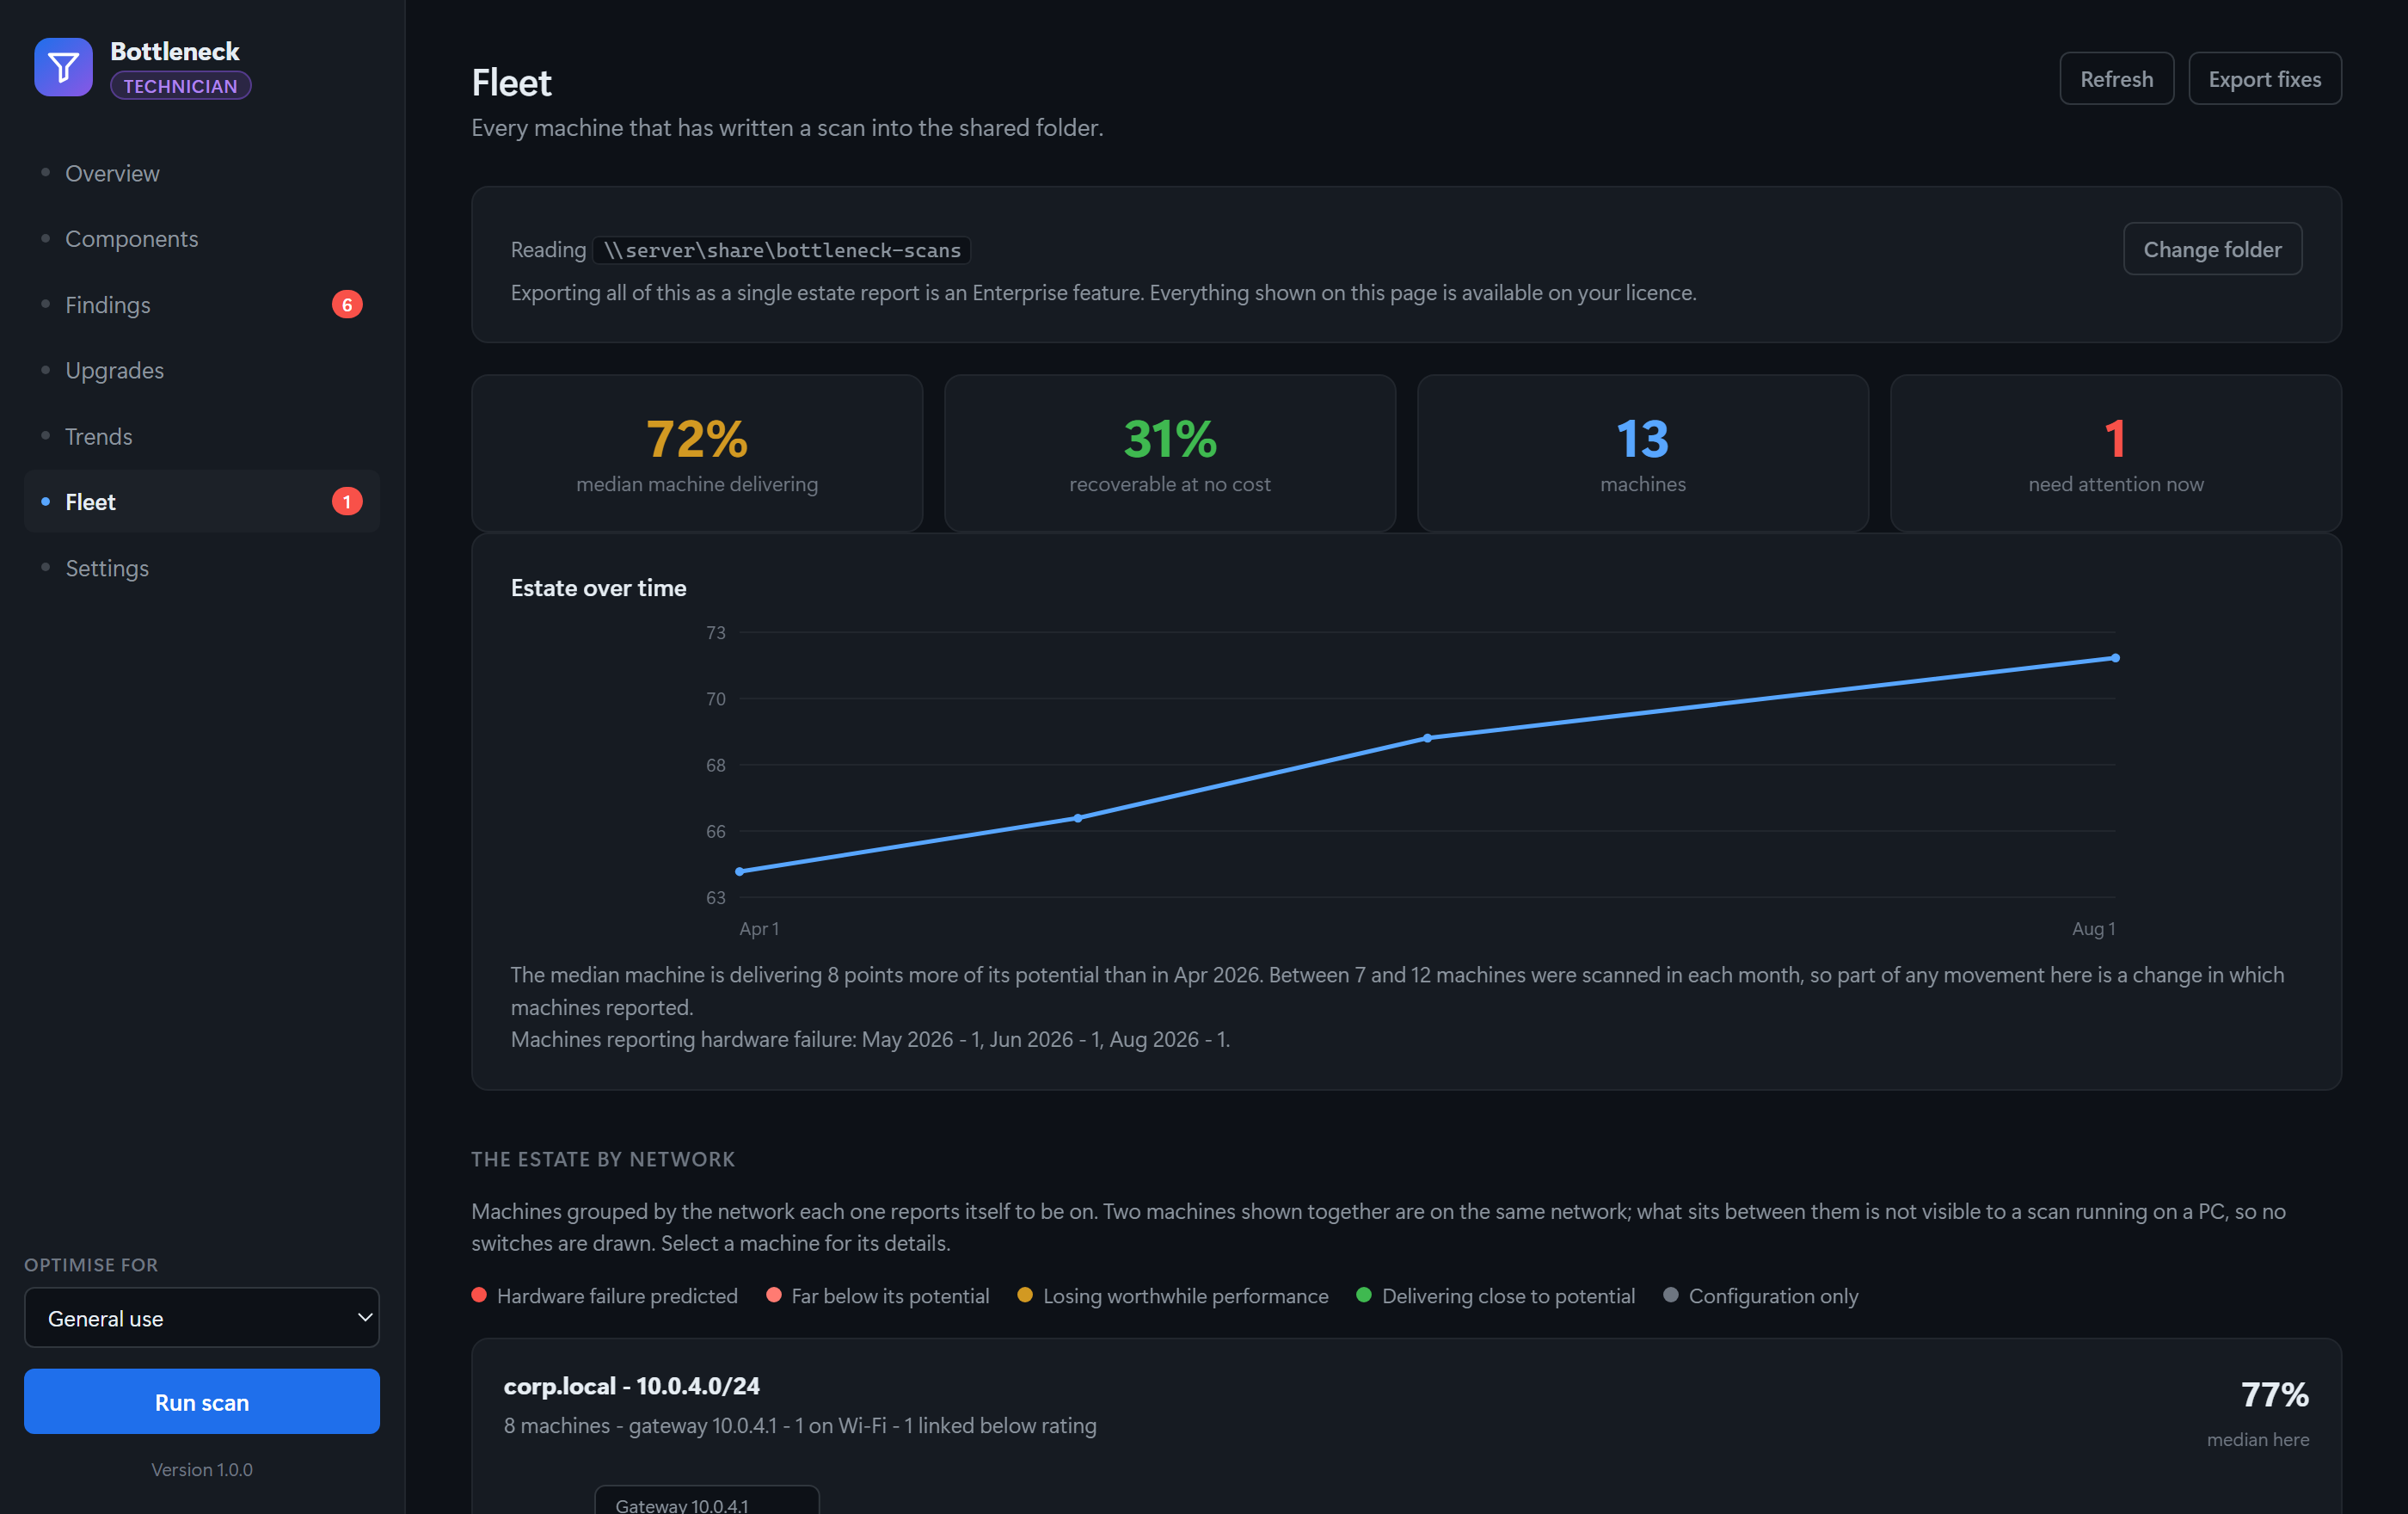
The Bottleneck fleet screen. Thirteen machines summarised: the median machine is delivering 72% of its potential, 31% is recoverable at no cost, and one machine needs attention now. Below, a chart of the estate over time and machines grouped by the network they report themselves to be on.
The fleet screen on a Technician licence. A single-machine report says “this computer is losing 20%”; an estate says which machines, whether one change fixes several of them, and whether things are getting better.

Privacy

Nothing about your machine leaves it.

There is no account, no telemetry, and no code path that transmits a scan. Results are written to your own disk and stay there.

One outbound request

A download of the reference dataset, carrying nothing about the machine — no hardware details, no results, no identifier. It can be switched off, and the application works identically without it.

Signature-verified data

That dataset drives purchase recommendations, so it is signed. Tampered data could push you toward buying things you do not need; a dataset that fails verification is discarded.

Licences checked offline

Your key is verified on your own machine against a public key compiled into the application. No activation server, so nothing to phone home to and nothing to go dark.

Pricing

Buy it once.

Licences are perpetual. The version you buy keeps working forever; only the entitlement to new versions lapses, after a year, and renewing it is optional.

Worth knowing

What it does not do.

A tool that overstates its certainty is worse than no tool, so here is where the edges are.

The baseline is seeded, not measured on every part

Expected scores come from published relative performance, anchored to measured hardware. For common parts this is close. For unusual configurations it is an estimate, and the application says so rather than presenting a confident number it cannot support.

Benchmarks are short by design

Scans take minutes, not hours. That is the right trade for a diagnostic you will actually run, but it means Bottleneck measures sustained throughput less thoroughly than a dedicated stress-testing suite does.

It is a Windows application

Windows 10 and 11 on x64. There is no macOS or Linux build, and none is planned — most of what it does reads Windows-specific configuration.

Seat counts are published, not enforced

An offline licence can prove a tier but never a count. Machine allowances are licence terms shown in Settings, not a lock. We would rather trust customers than add friction that punishes the honest ones.
Try it on the machine in front of you.

The free tier scans, benchmarks and scores, with no time limit.

Download free